Influencing Visual Processing
in Individuals with Disabilities
Overview
This work examined whether visual perception in neurodivergent individuals could be altered to promote big-picture image processing using an image filter.
Research Question
Can an image filter shift visual attention towards global (big picture) features?
Hypothesis
A image filtered to draw attention to salient areas will be able to shift eye gaze and encourage global processing.
Team
Multidisciplinary team, including a Psychology professor, a Computer Science/HCI professor, and an undergraduate student (myself)
Role
Collaborated with faculty members to conceptualize, design, conduct and analyze experimental study
Tools
Python, R, EyeLink Portable Duo Eye tracking machine
Background
Visual processing in humans is done by integrating and updating multiple streams of global and local sensory input. When this is not done smoothly, it becomes difficult to see the “big picture,” which has been found to have implications on emotion recognition, social skills, and conversation skills in individuals with Autism Spectrum Disorder (ASD) and other disabilities.
01
Background
Global features: men playing basketball against one another
Local details: lines in the basketball or colors of the jerseys

Foundational Work/Findings Explained
My role in this work was to clean and architect the data, then apply advanced statistical analysis techniques like multiple logistic regression, to determine the significance of the findings.
Published Foundational Work
Previous research in this field aimed to direct participants with ASD toward normative processing of the global features by developing and evaluating a filter which is intended to decrease local interference, or the prioritization of local details. The filter was unsuccessful in guiding attention but identified areas of improvement for the filter, which we built on in this study.
02
Foundational Work
Methods
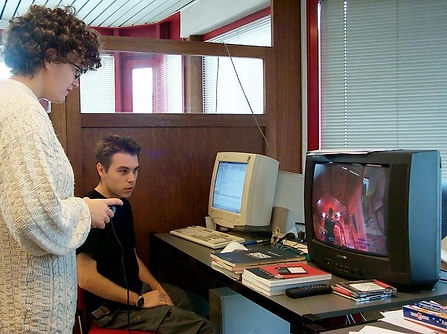
My faculty advisor and I had the privilege of traveling to California Community Opportunities (CCO), a nonprofit organization that teaches individuals with disabilities essential life skills in their own homes and communities. I have been volunteering at CCO-run program called Angels on Stage for 4 years now, so I had strong relationships with the staff and some of our study participants.
We ran this study on both neurodivergent and neurotypical individuals to examine the impact of the image filter. Participants were presented with a variety of images, both filtered and unfiltered (raw), and their eye gaze was tracked to show exactly where on the image they were looking (fixating).
03
Methods
Exploring San Francisco
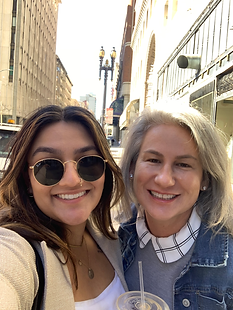
Photo Shoot in Union Square

Running Study Participants

Participants
We took great care in our study to ensure that each participant was comfortable and that the technology was set up in a way that worked for them. Some participants had physical limitations (wheelchairs, etc.) that we accommodated the setup for.
N = 7
-
Neurotypical: N = 1
-
Neurodivergent: N = 6
-
ASD Diagnosis: N = 2
-
X̄ Age: 22.42 (SD = 3.41)
Materials
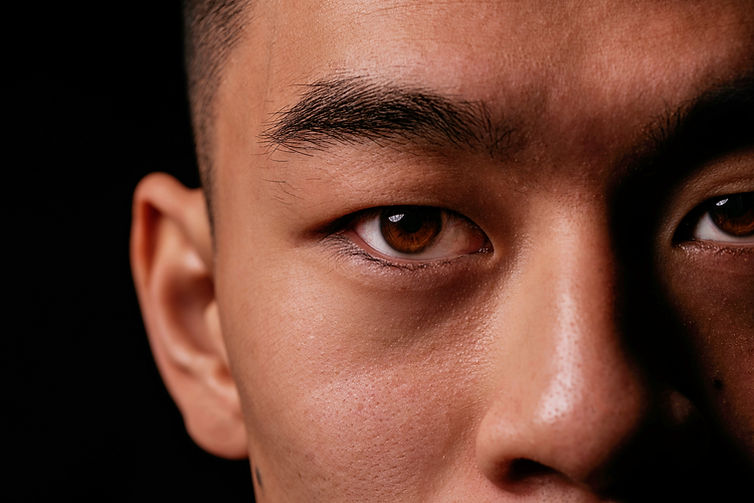
Images
Images were taken from an online database and were accompanied by heatmaps which showed where neurotypical individuals most often fixated -> hotspots
Raw Image
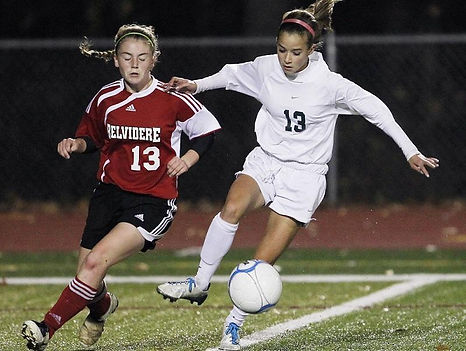
Hotspots
Head
Jersey
Head
Jersey
Ball
Eye Tracker
We mounted the eye tracker just over the laptop as shown below. Participants sat on a chair close enough to see the images on the laptop
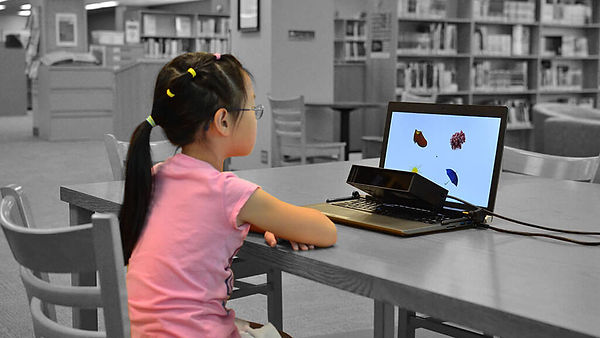
Image Filtering
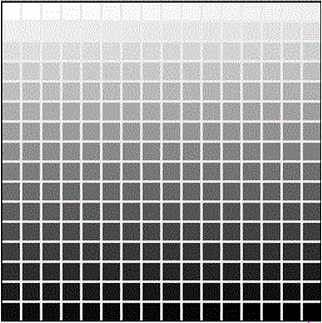
The filter works by manipulating image characteristics like spatial frequency (SF) and luminance.
-
Spatial Frequency (SF): the periodic distribution of light vs. dark in an image.
-
High SF: edges, fine details
-
Low SF: general orientation, global information
-
-
Luminance: the measure of how bright an image is, or the intensity of light in the image.
-
High luminance: more light/color
-
Low luminance: dull/desaturated
-
Research has shown that:
-
Low SF promotes global attention -> filtered images have low SF in hotspots
-
High luminance is more eye-catching for individuals with ASD -> hotspots are brighter and non-salient areas are dimmer
Spatial Frequency

Low High
Luminance
High Low
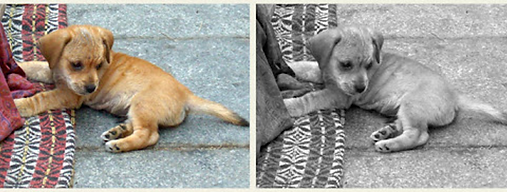
Raw Image
Filtered Image

Measures
Participants viewed a series of images and their eye gaze was tracked using the eye tracker.
IV: Image stimuli
-
Filter condition (filtered or unfiltered)
-
Social content (semantic or non-semantic)
DV: Eye gaze (fixations)
-
Where they looked (location) - (x, y) coordinates
-
How long they looked (duration) - milliseconds
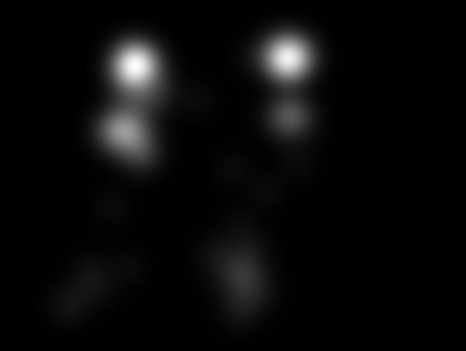
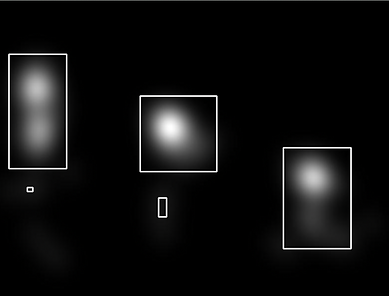
From this data, hit count and hit duration could be derived, which were measures of how many times and how long a participant fixated inside a hotspot.
-
Hotpots are rectangular bounding boxes that I algorithmically drew (using Python image processing) around pixels that were at or above a grayscale threshold of 20 out of 255
-
Everything at or above a threshold value of 20 is included in the hotspot bounding rectangle
Raw Image

Greyscale
Hotspots
04
Results
Overall Findings - Qualitative
Qualitative data we gathered through post-trial interviews showed that the filter did encourage global processing.
One participant was shown the following images and, when asked what she saw,
she said "container" for the raw and "pantry" for the filtered. She also mentioned that the
“black and white” images were “easier to look at” because “you don’t have to focus that hard.”
Raw Image
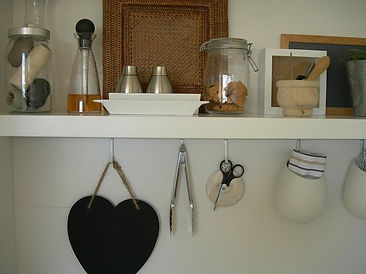
"Container"
Filtered Image

"Pantry"
Overall Findings - Quantitative
Quantitative data indicated that the filter did not shift eye gaze towards normative fixation areas (fixation location) or hold attention there (fixation duration)
However...
The image filter was effective in maintaining eye gaze in normative fixation areas for P5.
P5 experienced 33.89 ms longer hit duration in filtered images than in raw images, β = 33.89, SE = 10.42, t = 3.25, p < 0.01.
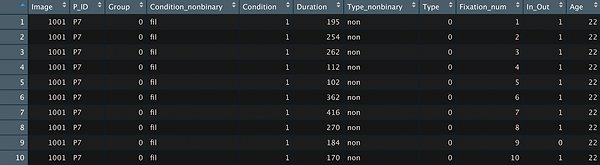
Data Cleaning
-
Raw data files from eye tracker
-
Export to Excel for basic cleaning
-
Python algorithm to calculate whether fixation was in or out of hotspot
-
Resulting database was parsed to add participant characteristics and other variables
Data Analysis & Modeling
I used R, a statistical analysis program, to run multiple models on the data.
Logistic Regression
-
DV: fixation location (in or out of hotspot)
-
Binary → logistic reg
-
-
IV: filter condition
Linear Regression
-
DV: hit duration (ms)
-
Continuous → linear reg
-
-
IV: filter condition
Discussion
Although the filter did not work as intended, the qualitative findings coupled with P5's results do hold some clinical significance and warrant further investigation.
05
Discussion
Real-World Implications
Web integration is a natural implementation of this filter.
Images within applications or on websites would be filtered to prime global processing, allowing for more efficient visual processing.
